
Products
We are a leading manufacturer of quality internal and external lighting products for commercial, industrial and retail applications.
View all productsProduct Types
Applications
At Ansell Lighting we design and manufacture an extensive range of luminaires for a diverse number of applications. Whatever the shape, purpose or style of your space, we have a lighting solution.
View all applicationsApplication Types
About
We are a leading manufacturer of quality internal and external lighting products for commercial, industrial and retail applications.
About overviewMore about us
Contact
We are here to answer any questions you may have, help you find a stockist or speak to a local member of our team.
Find out more
OCTO
OCTO delivers the complete smart lighting package to transform the efficiency and ambience of commercial and residential spaces.
OCTO overviewMore OCTO
Downloads
View and download our product catalogues, brochures and application guides. You can also search and download product datasheets, photometric and instructions.
Downloads available
Light source colour rendition – ANSI/IES TM30

Now we get to the final part of this trilogy of editorials on the measurement metrics of how an electric light source renders the colours of an object being illuminated by it.
This new system was developed because the main existing colour rendering metric widely used within the lighting industry, the CIE General Colour Rendering Index Ra was introduced more than 50 years ago, had remained unchanged since the last update of the 1970’s and although it has served the industry well over those years, its limitations were widely known. The the subsequent introduction of CQS from the National Institute of Standard and Technology (NIST) offered an improved methodology based upon a palette of 15 colours, which included saturated colours, but like the CIE version, only offered a single numeric value.
For this new metric, the Illumination Engineering Society of North America (IES) proposed another approach, which relied on even more extensive testing to evaluate light source colour rendition, in developing a system of several related measures and graphics which could be effectively used together to comprehensively evaluate and communicate the colour rendering properties of the light source being tested.
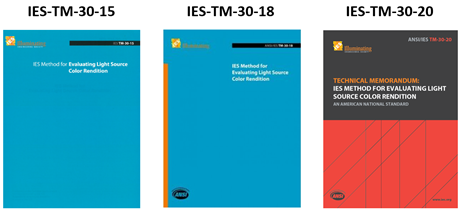
The IES Task Group worked under the IES Colour Committee, who subsequently upon completion, voted its approval, and this completed document was published as TM-30-15, as the ‘IES Method for Evaluating Light Source Colour Rendition’, where within its title, ‘TM’ is for Technical Memorandum, and ‘15’, the year for its initial publication.
Before considering the format of TM-30-15, it is worth stating that the IES subsequently published an updated version in 2018, called TM-30-18, which is a revision of the 2015 document, using the same title. The new TM document contained three modifications which achieve consistency with the International Commission on Illumination’s (CIE) publication at that time, namely CIE 224:2017, on the colour Fidelity Index for accurate scientific use.
More recently in 2020, the IES published a further updated version, TM-30-20, again using the same title and which is a re-publication of TM-30-18, but with the addition of Annex E and Annex F, and no other technical changes. In considering the addition of Annex E, this provides guidance for applying the measures defined in TM-30, clarifying important considerations for specifying light source colour rendition including the recommended specification criteria in linking specific colour rendition attributes with intended outcomes. For Annex F, this provides additional information to support the recommendations for specifying light source colour rendition as given within Annex E.
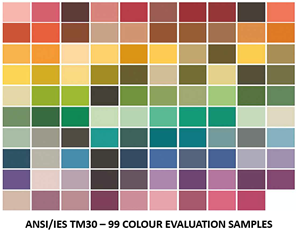
The emergence of this new test method proposed a solution where some of the content is very similar to that of previous metrics on colour rendering, in that there is still the use of colour samples, however unlike CRI (Ra), which uses just 8 colour samples and CQS, which uses 15 colour samples, the new metric of TM-30 utilises a palette of 99 colour samples which are uniformly taken from across the colour spectrum and where selection is based upon real world objects.
This solution provides a more accurate result, where the use of 99 Colour Evaluation Samples (CES) distributed uniformly across the colour space, using a blend of reference sources at a CCT of between 4500K and 5500K, allows for a more statistically representative and reliable metric in showing how accurate the colours will be rendered and where the colours being selected have been categorised into 7 different groups, that of Nature (1), Skin colour (2), Textiles (3), Paints (4), Plastics (5), Printed material (7), and Colour systems (7), which provides a beneficial solution for LED light sources, because the testing process can be undertaken as application specific. The colour swatches shown below, illustrate the approximate appearance of each sample under a 5000K reference illuminant.
This TM-30 test method generates the Fidelity Index (Rf), which has been calculated using a much larger number of colour samples than CRI or CQS, however, because it is an average value, the possibility remains that a higher value does not always indicate better colour quality.
For the Colour Gamut Index (Rg) from TM-30, this is the tested measurement of the Gamut for the light source being tested against that of the test source. The definition of the word ‘Gamut’ is ‘the complete range or scope of something’ and generally refers to an area enclosed by points in a chromaticity diagram, where for colour rendering, this refers to the area enclosed by a set of sample object colours and when compared to another area, for a different light source using the same samples, which can indicate relative changes in the colour appearance.
The Gamut Index, as that applicable to lighting, is the metric used to measure the increase, or decrease in Chroma of a light source, where the term ‘Chroma’ relates to the quality of the colour’s purity, intensity, or saturation value. The Gamut Index metric relates to how the colours being rendered will be over-saturated or under-saturated, and where a Gamut Index value of 100 will be considered as being that the rendering of colours is optimally placed.
However, where the Gamut Index (Rg) value is more than 100, it will indicate an average increase in saturation and where the Gamut Index value is less than 100, it will indicate an average decrease in saturation. The average level of saturation relative to familiar reference illuminant, is where the Gamut Index has an approximate value of between 60 and 140, when the Fidelity Index (Rf) is greater than 60, however, to get an acceptable colour quality, the score should be somewhere between that of 80 and 120, with higher scores representing higher levels of saturation, which then relates to the intensity of colour, with it being more intense than its natural colour as seen in sunlight.
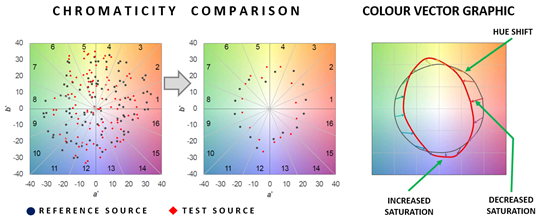
This test method also generates a Colour Vector Graphic, which presents a visual description of hue and saturation changes and is the form of measurement, to reveal how certain colours appear with the observed light, in whether the colours appear to be dull or more vivid, being an intuitive tool in showing which colours will have increased saturation, which colours will have decreased saturation, and which will be ideal through visual representation. Instead of using numbers to quantify the values of saturation, the image of the Colour Vector Graphic can demonstrate the changes of hue and saturation, thereby offering complementary information to that of both the Fidelity and Gamut Indices.
Since both the values of Fidelity Index and the Gamut Index are based upon average values, it is not possible to visualise which colours are saturated and which are not, which is where the Colour Vector Graphic becomes a very important method in having the ability to understand if the application has a specific need for the light source being proposed. The Colour Vector Graphic is used alongside the values obtained for both the Fidelity Index and Gamut Index, which will help to provide a more precise idea of how true colours will be viewed with that light source.
In concluding, the evolution of metrics for colour rendition have moved from the measurement of Colour Rendering Index (Ra) which uses just 8 samples based upon offering only the metric of Colour Fidelity, through the improved Colour Quality Scale, where 15 samples are used, and finally to this ANSI/IES TM-30 method for evaluating light source colour rendition, which offers the benefit of 99 colour evaluation samples to determine Colour Fidelity (Rf) and with the additional metric of the Gamut Index (Rg), as well as the Colour Vector Graphic, allows for a more accurate method to match the light source to the application, and with a greater assurance of achieving the optimum colour rendering solution.
You Might Also Be Interested In...

Colour rendering – Colour Rendering Index (CRI)
Subscribe to our newsletter
Get monthly news, tips, and new product updates delivered straight to your inbox.
Email addresses are never sold or given out to anybody. By subscribing, you agree to our Privacy Policy and Terms.